Minimum participation
Reporting requires at least 100 people to sign up for the app, plus enough consenting participants for each insight.
StrengthHub can help you explore the wellbeing habits and trends across your organisation, giving you insights to guide your decisions. Here are some questions those insights could help answer.
StrengthHub tracks sleep, recovery, nutrition, hydration and activity across your organisation and reports these insights in aggregate. This helps you identify potential barriers to employee wellbeing and productivity, and understand where your support could make the greatest impact.
For example: Over the past four months, you've noticed a decline in energy and productivity. You assume it's a motivation issue, but what you didn't know is that employees are averaging just 5.5 hours of sleep against a goal of 7 hours. With these insights, you can introduce initiatives that encourage better sleep habits and recovery.
StrengthHub tracks key wellbeing indicators over time, helping you measure the impact of your initiatives and understand whether they're making a meaningful difference.
For example: Following a company initiative encouraging employees to reduce screen time before bed, average sleep increases from 5.5 to 6.8 hours per night over three months. These measurable improvements help you evaluate the initiative's effectiveness and identify opportunities to further support employee wellbeing.
StrengthHub benchmarks your organisation's wellbeing and activity trends against the platform average and other organisations in your industry, helping you understand where your organisation is performing well and where there is room for improvement.
For example: Your employees average 6,200 steps per day, compared to the platform average of 7,100 and 7,500 across other consulting firms. This highlights a measurable gap and an opportunity to introduce initiatives that encourage greater daily activity.
Many organisations plan employee benefits, events and wellbeing initiatives based on industry trends. However, what works across the broader market may be very different from what your own people actually want.
For example: Industry data suggests that 31% of employees enjoy cricket, so you organise a company cricket day, only to receive limited interest. What you didn't know is that 21% of your own employees play pickleball every week. With these insights, you could have organised an activity better suited to your team.
Same budget, better decisions and greater participation.
StrengthHub encourages friendly competition based on consistency and effort, rather than fitness levels or performance, making participation accessible to everyone. These insights help you understand employee involvement, team engagement and opportunities to build a stronger workplace culture.
For example: You discover that 70% of participating employees have joined your workplace fitness league. This demonstrates an interest in shared activities and provides an opportunity to encourage friendly competition, recognise achievements and reward participation.
Employees can record genuinely busy periods in StrengthHub, such as holidays, deadlines and demanding work schedules. This helps distinguish between missed activities during busy periods and lower participation at other times.
StrengthHub reports these trends in aggregate, helping you understand the pressures affecting your organisation, identify potential signs of declining engagement and recognise where additional support may be needed.
For example: You discover that 30% of employees regularly miss at least one planned workout or sporting activity each week outside their scheduled busy periods. Rather than assuming it's a lack of motivation, these insights could indicate that employee fitness and wellbeing are being compromised by unrecorded workload pressures or competing priorities.
Changes in healthy habits can appear before changes in workplace performance, giving you an opportunity to support your organisation before larger problems emerge.
StrengthHub provides insights into employee routines, including preferred training days, nutrition habits and activity trends over time. These aggregated insights help you understand when activity is highest across your organisation and how to better plan around established routines.
For example: You discover that 45% of employees regularly train on Tuesdays and Thursdays. These days may reflect higher activity levels, but could also be less suitable for events after work. With this knowledge, you can schedule workplace activities around your staff rather than competing with them.
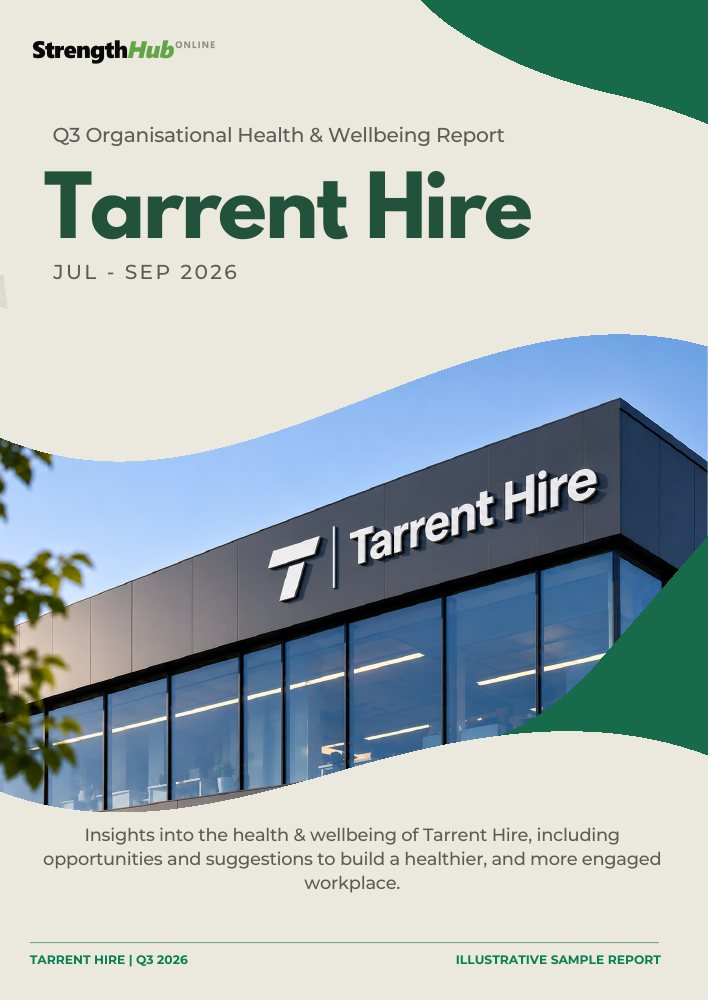
This illustrative report has 13 pages showing how organisational activity and wellbeing trends, analysis and suggested priorities could be presented. The organisation and figures are examples, not customer results. PDF, 7 MB.
Understand your organisation’s wellbeing while protecting each person’s privacy.
Reporting requires at least 100 people to sign up for the app, plus enough consenting participants for each insight.
Organisations do not receive individual wellbeing records or private Coach conversations. Limited, authorised StrengthHub support access is separate from organisation reporting.
People must be told how their information would be used and give consent before it contributes to an organisation report.
Any organisation report would combine data without identifying individuals, with safeguards for small groups. Reporting depends on an agreed arrangement and available data.
Read the Privacy Policy for more about how personal information is handled.
All examples and figures presented on this page are illustrative and do not represent actual customer results.
Leave your details. We’ll review your organisation and email you to arrange a meeting.